Overriding Specific Cell Colors
Examples for the 3D Surface Mesh Chart can be found in the SciChart WPF Examples Suite which can be downloaded from the SciChart Website or our SciChart.WPF.Examples Github Repository.
In addition to custom palettes, heightmaps, textures, you can override a specific cell or cells in the SurfaceMeshRenderableSeries3D by using the PaletteProvider3D property.
For example:
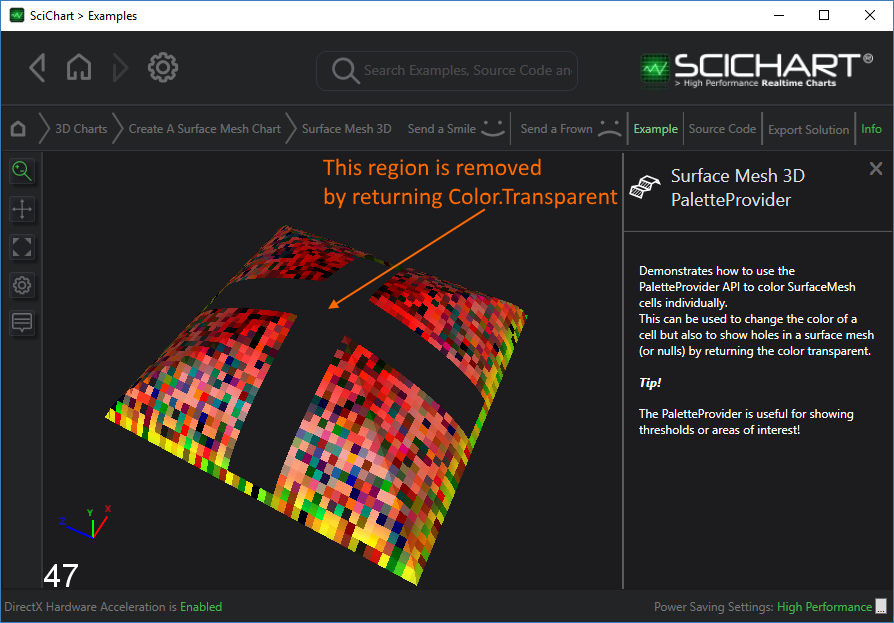
- You can remove specific cells or mark them as NULL by overriding the cell color to be Transparent
- You can mark regions of interest, say certain cells in a value range, or with index must be colored differently.
- With higher resolution meshes, you can change the shape of the mesh to circular (approx) by removing cells outside of a region.
| ISurfaceMeshPaletteProvider Example |
Copy Code |
|---|---|
// 1.) Create a class which implements ISurfaceMeshPaletteProvider3D // 2.) override OverrideCellColor. Return NULL for default color, Transparent for transparent or // specific color if a Color is required at that cell public class CustomPaletteProvider : ISurfaceMeshPaletteProvider3D { private List<Color> _colors; private Random _random; public void OnAttach(IRenderableSeries3D renderSeries) { _colors = typeof(Colors).GetProperties().Select(x => (Color)x.GetValue(null, null)).ToList(); _random = new Random(); } public void OnDetached() { _colors = null; } public Color? OverrideCellColor(IRenderableSeries3D series, int xIndex, int zIndex) { // In this example if the index falls in a specific range, we return a null or empty color // Else, we return a random color // Optional: You can access the data values here with this code // var data = series.DataSeries as UniformGridDataSeries3D<double, double, double>; // double yValue = data[zIndex, xIndex]; if (zIndex == 0 || xIndex == 0 || zIndex == 47 || xIndex == 47) { return _colors[_random.Next(1, _colors.Count())]; } else if ((zIndex >= 20 && zIndex <= 26) || (xIndex >= 20 && xIndex <= 26)) { return (Color?)Colors.Transparent; } return _colors[_random.Next(1, _colors.Count())]; } } // 3.) Apply the PaletteProvider to a Surface Mesh chart surfaceMeshRenderableSeries.PaletteProvider = new CustomPaletteProvider(); | |
This results in the following: